1 / 7
XL
I libri XL hanno un'altezza minima di 34 cm, ad eccezione dei titoli in formato orizzontale.
History of Information Graphics
80
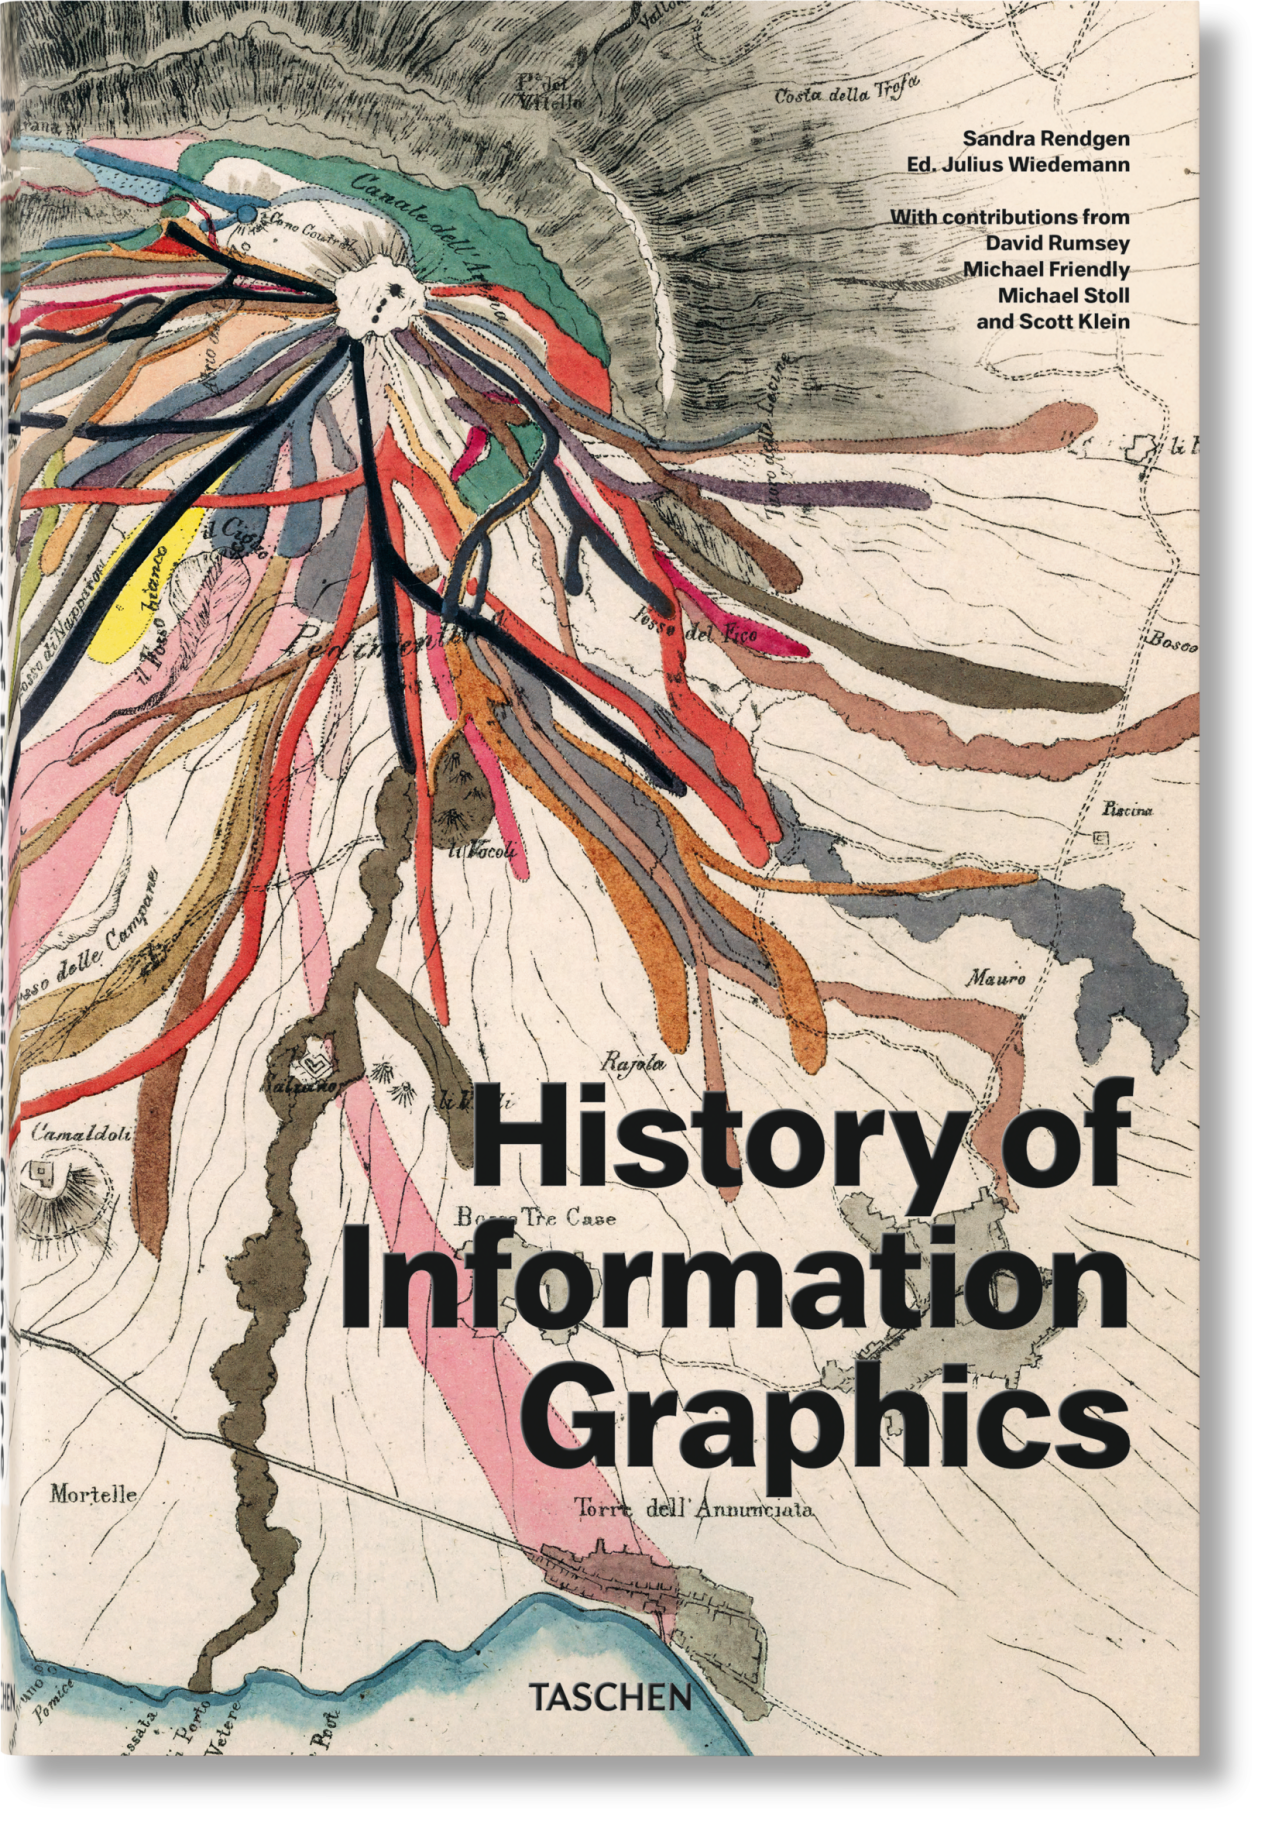
Dalle carte del cosmo e dall'Uomo Vitruviano di Da Vinci fino alla mappa della metropolitana di New York: ripercorri la storia dei dati visivi dal Medioevo all'era digitale in questo compendio XL. Con circa 400 pietre miliari dell'infografica in campo tecnologico, cartografico, zoologico e altro ancora, questa è un'opera di riferimento senza precedenti per designer, appassionati di storia e chiunque abbia sete di conoscenza.
Hardcover with six foldouts, 9.7 x 14.6 in., 8.34 lb, 462 pagine
XL
I libri XL hanno un'altezza minima di 34 cm, ad eccezione dei titoli in formato orizzontale.

History of Information Graphics
80Data Trails
A detailed compendium on the history of knowledge
In the age of big data and digital distribution, when news travel ever further and faster and media outlets compete for a fleeting slice of online attention, information graphics have swept center stage. At once nuanced and neat, they distill abstract ideas, complex statistics, and cutting-edge discoveries into succinct, compelling, and masterful designs. Cartographers, programmers, statisticians, designers, scientists, and journalists have developed a new field of expertise in visualizing knowledge.
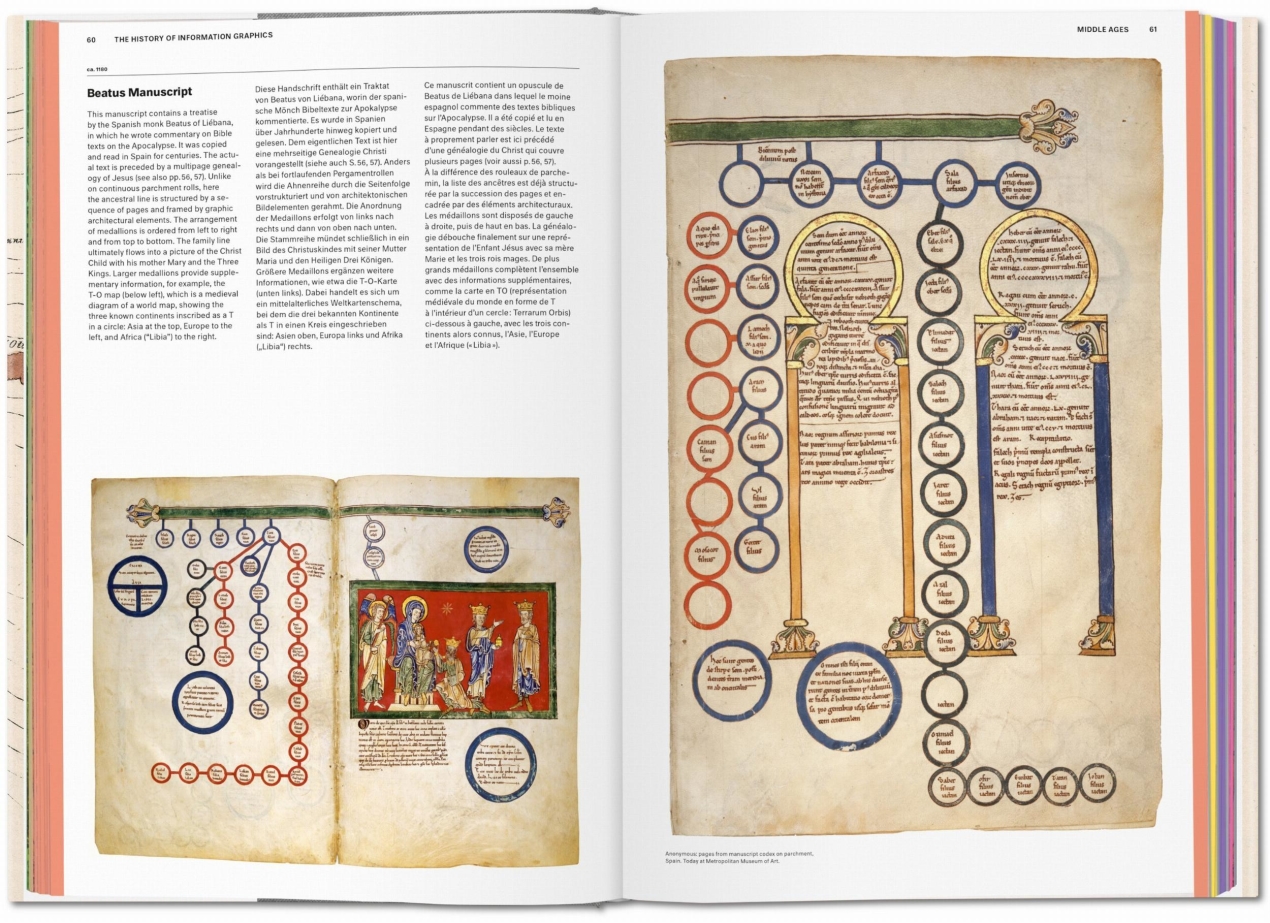
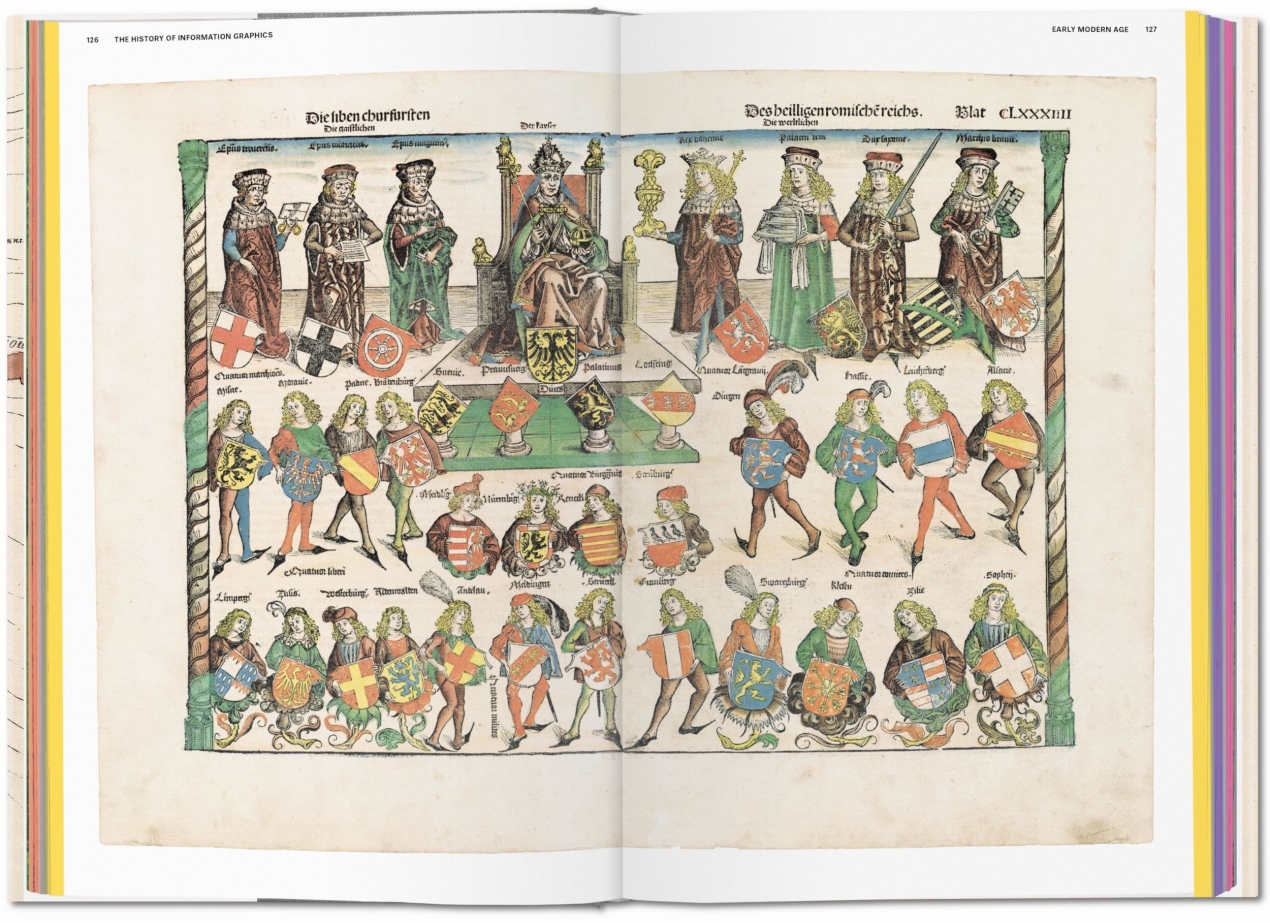
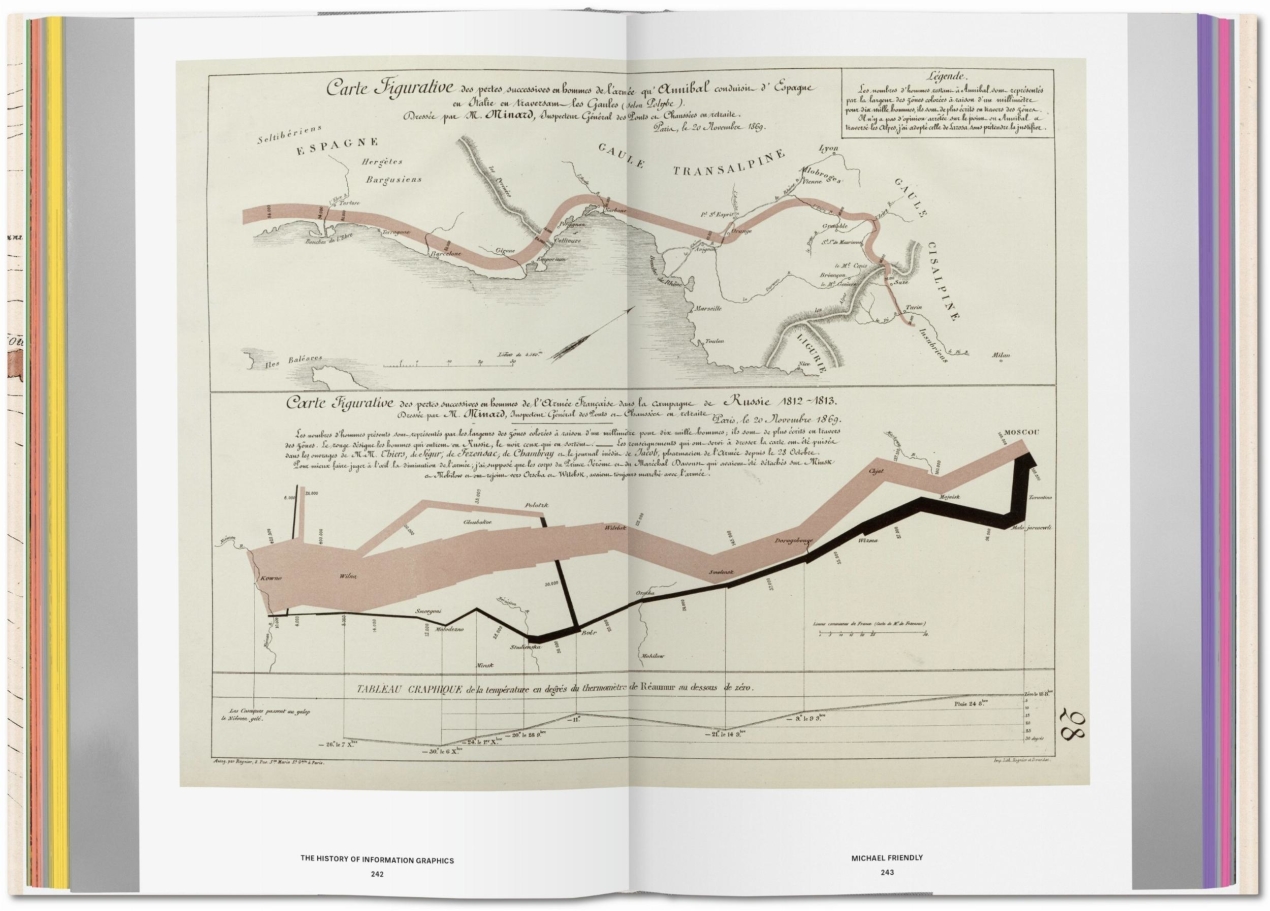
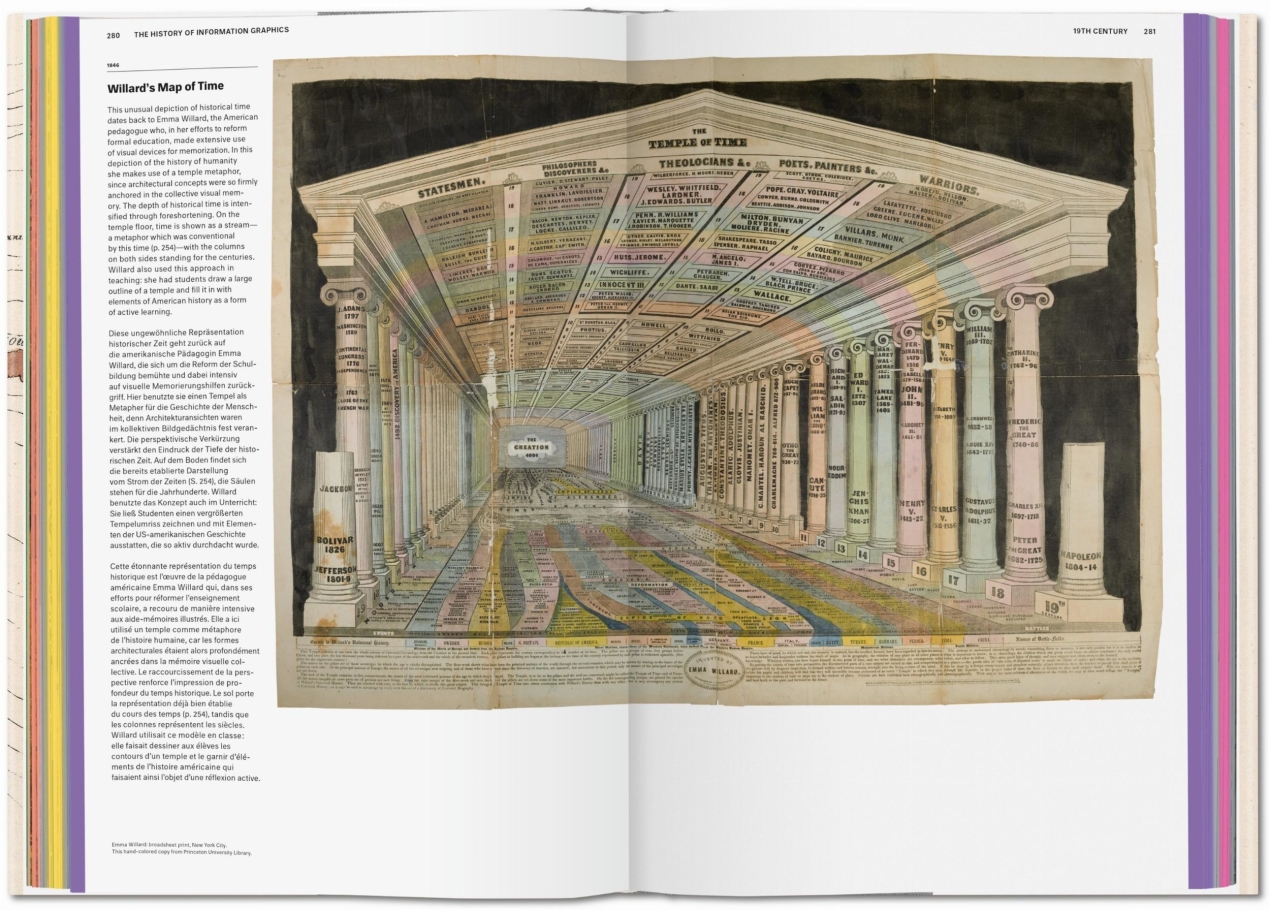
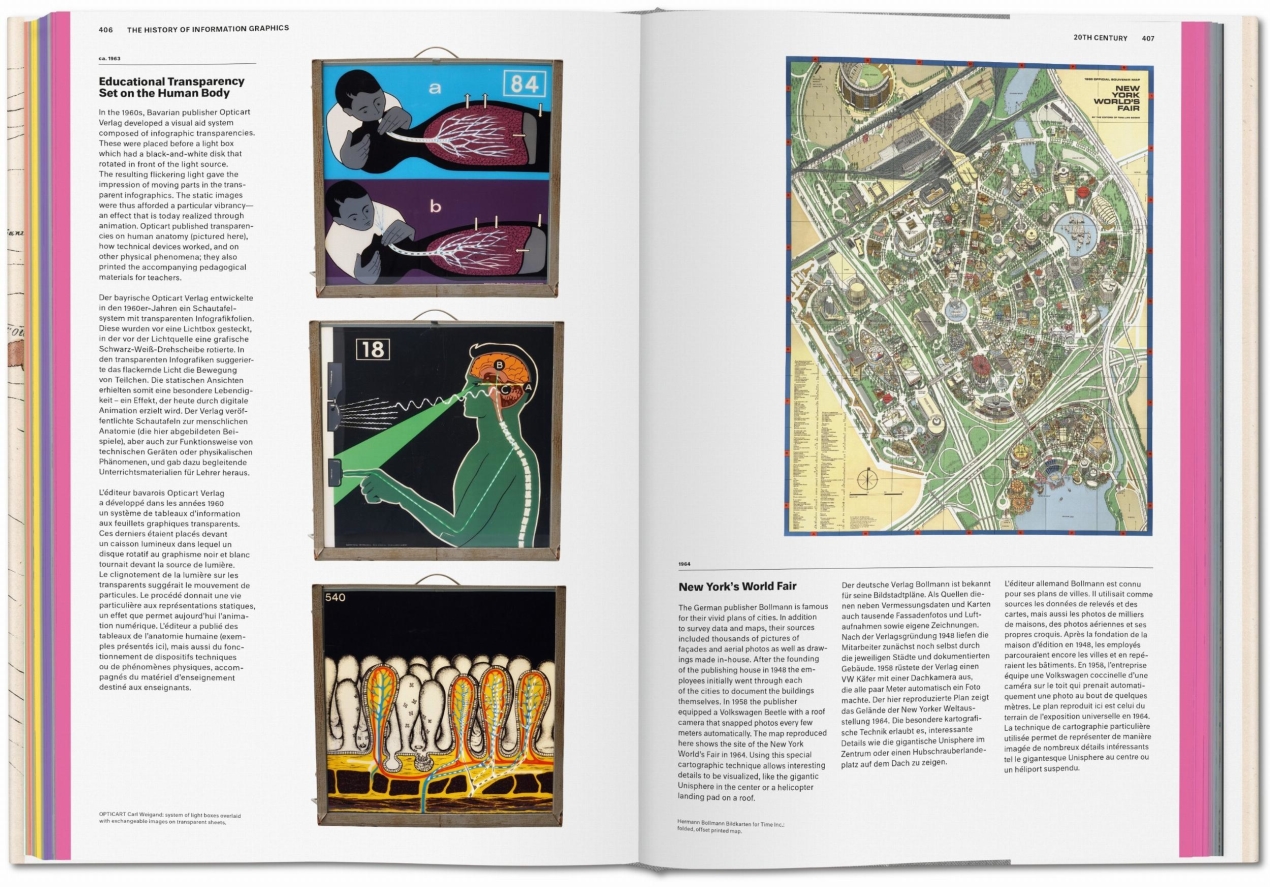
This XL-sized compendium explores the history of data graphics from the Middle Ages right through to the digital era. Curated by Sandra Rendgen, some 400 milestones span astronomy, cartography, zoology, technology, and beyond. Across medieval manuscripts and parchment rolls, elaborate maps, splendid popular atlasses, and early computer-based information design, we systematically break down each work’s historical context, including such highlights as Martin Waldseemüller’s famous world map, the meticulous nature studies of Ernst Haeckel, and many unknown treasures.
Hot on the heels of the best-selling Information Graphics and Understanding the World, this third volume fills the gap as an unprecedented reference book for data freaks, designers, historians, and anyone thirsty for knowledge. An enthralling exploration into the teachings, research, and lives of generations past.
L'autore
Sandra Rendgen studied art history and cultural studies in Berlin and Amsterdam. Her work both as an editor and in developing concepts for media installations concentrates at the interface between image culture and technology, with a particular focus on data visualization, interactive media and the history of how information is conveyed. She is the author of TASCHEN’s Information Graphics and Understanding the World.
L'editore
Julius Wiedemann ha studiato graphic design e marketing, e ha lavorato come art editor per diverse riviste di design e digital media a Tokyo. Le sue numerose pubblicazioni per i tipi di TASCHEN dedicati ai media digitali includono Illustration Now!, Logo Design, Jazz Covers e Information Graphics.
History of Information Graphics
Hardcover with six foldouts, 24.6 x 37.2 cm, 3.79 kg, 462 pagineISBN 978-3-8365-6767-1
Edizione: Multilingue (Francese, Inglese, Tedesco)Scarica qui le immagini del prodotto
4.8
Sehr vielfältig
2 novembre 2021
Hier sieht man sehr eindrucksvoll auf wie viele unterschiediche Art und Weisen Informationen illustriert und veranschaulicht werden können. Meiner Meinung nach nicht immer ideal oder leicht verständlich, aber stets originell, einzigartig und professionell. Das Buch eignet sich gut als Inspirationsquelle und zeigt auch die Entwicklung der Infografiken von ihren Anfängen bis heute sehr anschaulich. Manche Grafiken sind echte "Ungetüme" die man lange studieren muss, andere sind simpel und on point.Un livre qui fait découvrir un univers curieux
29 ottobre 2021
Voici un livre inhabituel qui ouvre une vision sur l'univers du graphisme depuis les temps anciens jusqu'à nos jours. Le sujet étant peu courant il permet une large découverte digne d'intérêt. Les illustrations sont judicieusement choisies, commentées et mises en valeur. A recommander pour tout esprit curieux.Interessante
28 ottobre 2021
Ottimo testo per visualizzare graficamente l’evoluzione delle rappresentazioni dei dati, oggi estremamente utili. Secondo me si completa perfettamente con Information Graphics.magnificent book
28 ottobre 2021
This book is fantastic, as much in its format, as in the richness of the content! The resources are interesting and richly commented. Thank you for this book!Better understand data!
27 ottobre 2021
Data is becoming increasingly important in our lives, but it is often too complex and obscure to be accessible. By giving them an intelligible and meaningful form, data designers make the knowledge they reveal reachable. This work of shaping and clarifying data is as old as that of writing. This book marvelously retraces the history of data representation and sheds new light on the increasingly important role of data visualization.Excellent
27 ottobre 2021
Tres informatif, je recommande, c'est le deuxième de cette série que j'achète
